What’s the current status of mobile app statistics in 2019?
According to data from previous years, we know that mobile device app statistics on usage is on a steady incline. Year after year, we see new numbers that point to the dominance of mobile — particularly mobile apps — in the world of computer usage.
For example, a 2017 study found that 87 percent of time spent on mobile happens within mobile apps, with the remaining 13 percent occurring on mobile web. And on a broader scale: Since 2017, over half of all website traffic worldwide has occurred from mobile devices.
In 2019, it’s critical for any business to understand the latest app usage trends. But aside from the broad trend of increased traffic on mobile versus desktop, there are still more statistics that savvy app businesses should keep an eye on.
Without further ado, we present our list of the six mobile app usage statistics you probably haven’t heard of.
1) In 2018, 113 Billion Apps Were Downloaded on the App Store and Google Play
We usually talk about app usage statistics in terms of percentages, but sometimes relative figures can conceal the true scope of the industry we’re dealing with. In 2018, app downloads across both the Apple App Store and Google Play increased by 10 percent. In relative terms, this is an impressive but still modest number. However, in absolute terms, this 10 percent increase brings us up to over 100 billion app installs in a single year.
Granted, there are some caveats to this statistic. Many users would have uninstalled some of their new apps, and it doesn’t tell us how much revenue was generated by these newly acquired users.
Still, this app usage statistic points to the sheer size and scope of the mobile app industry in 2019. Mobile users are still actively seeking out new app experiences, and they don’t hesitate to install news apps to test them out.
2) There Are Nearly 500K Apps Available in the Amazon App Store
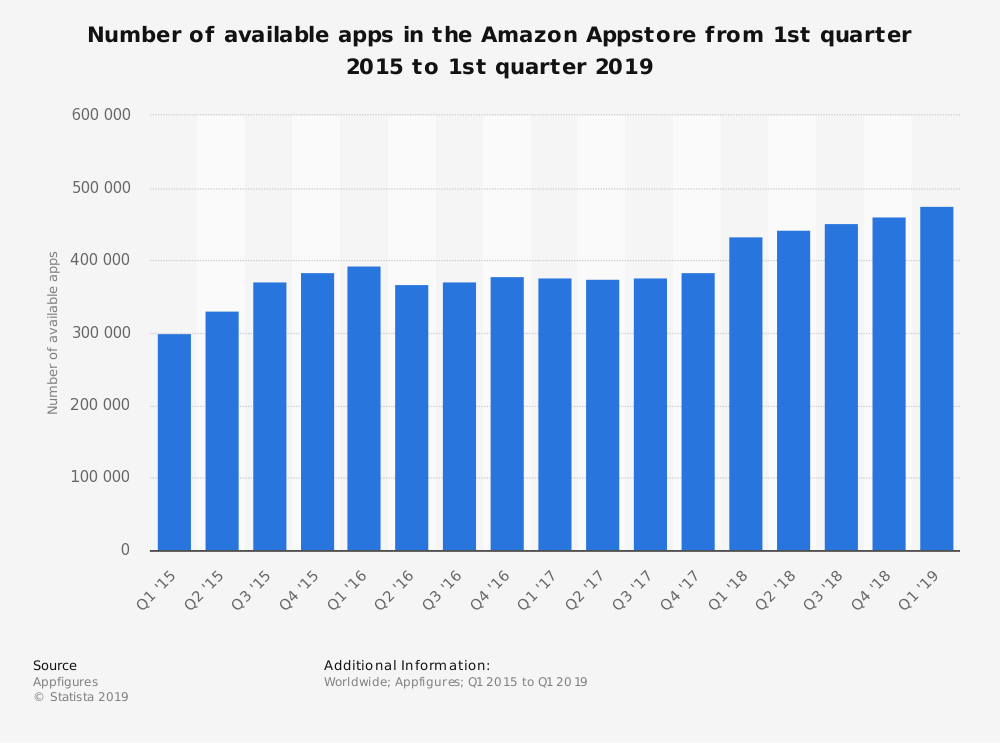
That’s right: The Amazon App Store (mobile only) currently serves roughly 500 thousand apps, compared with just over 2.5 million apps available on Google Play. Though not as big as the big two, this is still a non-trivial number.
The Amazon App Store doesn’t serve iOS apps, but it’s a sizable player in the Android app market. It would be wise for mobile teams to study not just mobile app usage, but also app store usage. The ways in which users interact with app stores, as well as the store that they choose to use, could have a significant impact on your user acquisition. If your Android app is exclusively available on Google Play, you could be missing out on customers who primarily browse the Amazon store from their Amazon tablets.
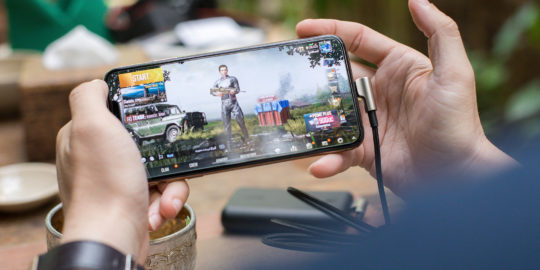
3) Gaming Is the Most Popular According to Apps Usage Statistics
On both the App Store and Play Store, games retain their position as the most downloaded category of apps. App usage trends indicate that the demand for mobile games is not to be underestimated. In Q1 2019, the Gaming category earned 2.2 billion app downloads on the App Store, with Photo and Video trailing behind at a distant second with 570 million downloads.
This means gaming apps earned just under 4x the total downloads of the second most popular app category. Now this is an app usage trend that developers and marketers won’t want to miss.
On one hand, app users’ fondness for games is a good thing for game developers. It means that there’s a strong demand for their sector; a higher total download count means a higher chance that your app will be discovered.
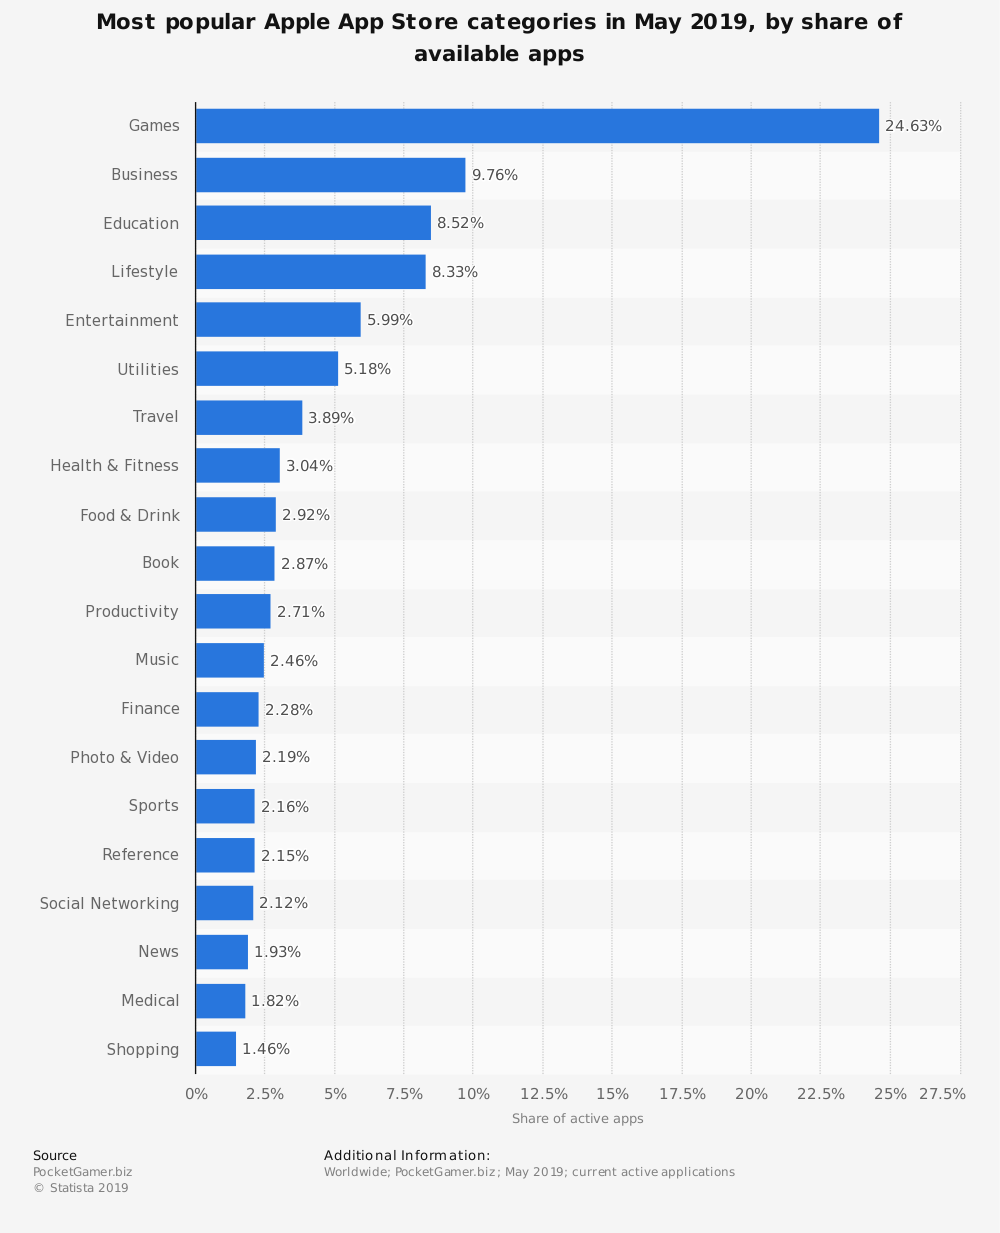
But like all app usage, this number only shows half of the story. It’s also true that Gaming apps comprise nearly 25 percent of the App Store, with Business apps sitting at a distant second with 10 percent. So, while it’s true that there’s a high demand for gaming apps by app users, we must remember that there is a lot of competition as well.
4) Time Spent On Smartphones Is Increasing Every Year
One of the most important app statistics about usage to note is the fact that consumers are still spending a lot of time on mobile. In fact, we’re not sure where the time is coming from, but US customers spent 10 percent more time on mobile devices in 2018 compared to 2017. This brings the total number up to an average of three hours per day.
This app usage statistic is valuable because it gets straight to the heart of the matter. It’s not just about the size of the mobile market or the number of devices in the world; it’s about the average time that each individual customer spends on mobile. If that number continues to rise, then it’s good news for mobile app teams around the world. More app engagement per user means more potential revenue from each user.
5) Mobile Apps Drive 100-300 Percent More Conversions Than Mobile Websites
It’s not just that users spend more time on mobile apps than mobile web. Data has also shown that mobile apps lead to anywhere between 100 percent and 300 percent more conversions, compared to a similar experience on the web.
That’s not to say that your mobile website should be ignored completely. There is still a market for mobile web, and many companies use their website to encourage users to download the official app. It can be a good source of user acquisition for your app.
However, for a mobile team that’s thinking long-term, it would be better to invest in a quality mobile app as soon as possible. A mobile website probably shouldn’t be at the center of a long-term mobile strategy, but it can still be a powerful component of an app-based strategy.
6) Most US Smartphone Users Download Zero Apps Per Month
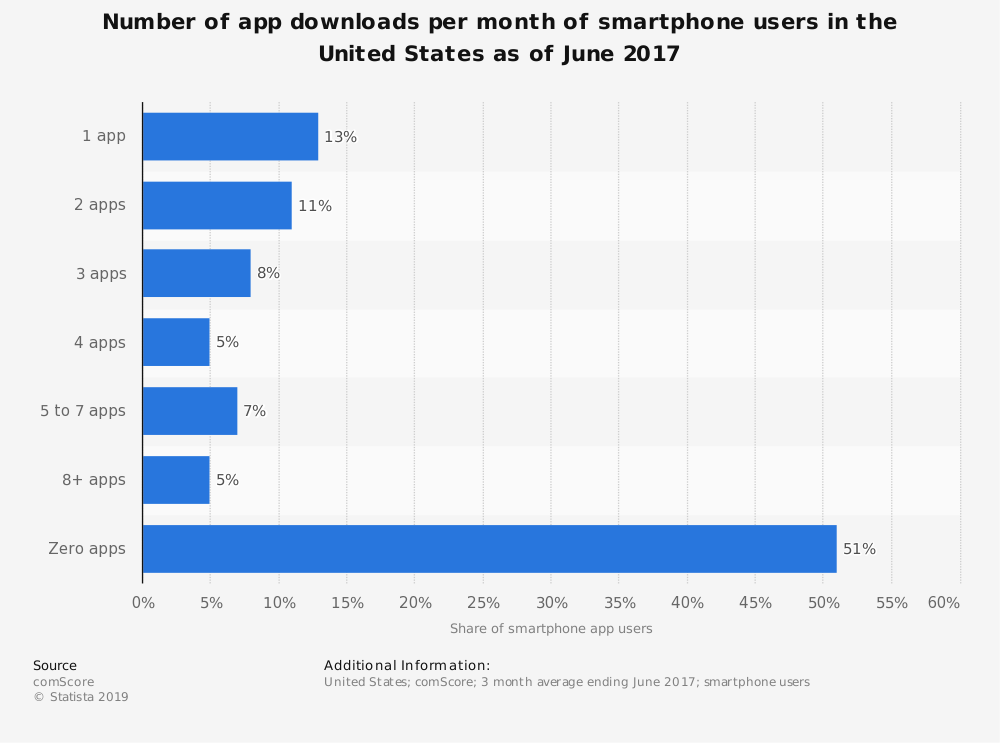
Yes, you heard that right — on average, over 50 percent of mobile users in the US download zero apps per month.
This is an interesting app usage statistic to unpack. On one hand, the total number of available apps and app installs keeps rising, as seen in the first and second point in this post. But when we take an average of the US market, we find that people just aren’t downloading as many new apps as you might think.
We must keep in mind that this apps usage statistic is limited to the US market, while the total download counts on Google Play/App Store are a worldwide metric. It’s quite possible that people in emerging markets download more apps because mobile products are relatively newer in those countries. In the US, the mobile market is already over 10 years old, so many people have already picked an app for each use case and therefore don’t need to download more.
However, the statistic about increased time spent on smartphones was for US customers, not worldwide customers. So even though American consumers may not be downloading as many apps as they used to, they are still using their current apps more than ever before.
Getting In-Depth With App Usage Statistics and Mobile Engagement
Still looking for more data and insight on mobile app usage? Have a look at our 2018 Mobile App Engagement Index. This report breaks down critical metrics for all mobile teams, such as the average cost per install or purchase, the average retention rates on Android and iOS, and much, much more. Read the report to get up to date with all the key metrics surrounding mobile app usage.
—
Leanplum is a mobile engagement platform that helps forward-looking brands like Grab, Tinder, and Tesco meet the real-time needs of their customers. Schedule your personalized demo here.