
Source: Freepik
Looking for the essential app statistics behind mobile marketing, user habits, and more? You’ll find them all here. We’ve aggregated 21 must-see mobile marketing statistics into a single list, featuring content from around the industry. Read on for the latest mobile app stats.
1. In the US in Q1 2017, smartphone owners had an average of almost 100 apps installed on their devices, but only used about 40 of them on a monthly basis. (Source)
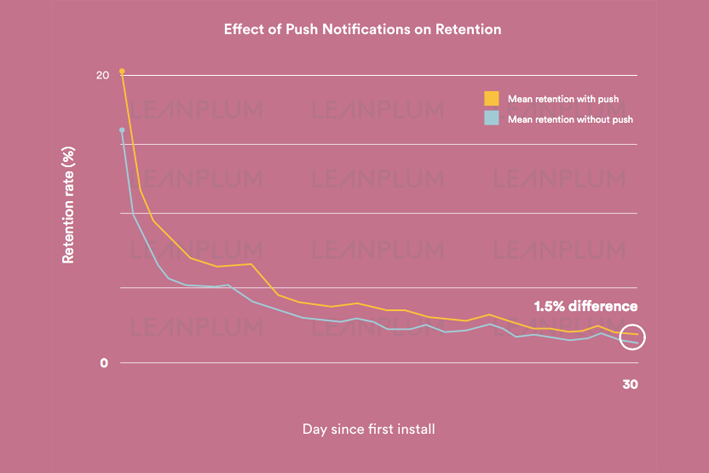
Standing out among 89 apps isn’t easy. Luckily, push notifications offer a way to get noticed — even if users aren’t launching your app on a daily basis.
2. In the US in 2017, mobile users spent an average of 2.3 hours per day with digital media. (Source)
This stat proves that mobile apps play a big role in the average person’s daily entertainment. Media apps, take note (and optimize your engagement with these tips).
3. As of January 2017, there are 2.2M iOS apps on the App Store. (Source)
The number of apps in the App Store is steadily increasing, which means it’s that much harder to stand out from the competition. Retaining engaged users is more important than ever.
4. As of June of 2017, there are 3M Android apps on Google Play. (Source)
The Google Play store presents the same challenge as the App Store. More apps in total means less discoverability for new apps.
5. Number of mobile app downloads worldwide: 149B in 2016 versus 197B in 2017. (Source)
Good news for app businesses: Mobile app downloads are still on the rise. Despite the saturation of the App Store, mobile users are still experimenting with new apps.
6. Android became the world’s most-used operating system (mobile or desktop) in 2017, surpassing Windows. (Source)
Yet another sign of the mobile-first (and mobile-only) trend taking the world by storm. While Android has traditionally maintained a market share lead over iOS due to its presence in developing markets, this is the first time the mobile OS has eclipsed Windows, which is still the leading desktop OS. This suggests that mobile traffic as a whole is eclipsing desktop.
7. Top three apps in terms of penetration: Facebook (81 percent), YouTube (71 percent), and Facebook Messenger third with (68 percent). (Source)
These iconic apps are used by the majority of mobile users, and they likely represent much of the time spent on mobile as well. It takes a focused engagement strategy to attract users away from the most popular apps and make them spend time with your app.
8. People use an average of nine apps per day and 30 apps per month. (Source)
Nine apps per day might sound like a lot, but when you consider the proliferation of leading apps as shown above, it’s clear that you’re still competing with the industry leaders. It’s not easy to become one of those nine apps and turn someone into a Daily Active User. Fortunately, app teams can step up their mobile marketing with cross-channel messaging campaigns — the one solution proven to increase retention.
9. Share of time spent per app category: Entertainment and Communication (20 percent), Music (18 percent), and Multimedia and Games (10 percent each). (Source)
Even though games are the most popular category by number of apps, they’re only third when sorted by time spent in app. Messaging and media apps still have the lead when it comes to keeping users active and engaged.
10. Apps account for 89 percent of mobile media time, with the other 11 percent spent on websites. (Source)
Mobile apps are winning the battle against mobile websites. If your company hasn’t developed a mobile app to complement the other platforms you operate on, now’s the time to do it.
11. 56 percent of emails are opened on mobile. (Source)
It’s evident that email matters more than ever in our mobile-first world. In addition to ensuring messages are mobile-compatible, it’s helpful to design emails from the ground up with mobile in mind. Mobile screens are one of the primary ways that users will consume your content — it’s not a secondary consideration.
12. More searches happen on mobile than on computers/tablets for 15 of the 24 hours in a typical day. (Source)
Desktop searches generally take the lead during the work day, but mobile searches lead in the early mornings and they peak during prime time hours.
13. The average smartphone conversion rate is up 64 percent compared to the average desktop conversion rate. (Source)
The notion that mobile users don’t convert is a myth. People are growing more comfortable with mobile purchases, both in apps and on websites. Abandoned shopping carts are still a problem, but desktop websites face this issue as well. Both mobile and desktop businesses can combat abandoned shopping carts with cross-channel messaging campaigns.
14. Of the mobile users who stop using an app, 30 percent would use it again if offered a discount, and 24 percent would use it again if offered exclusive or bonus content. (Source)
Don’t give up on dormant users. Even if a person stops using the app regularly, you can still reach them with targeted messaging and give them a reason to return.
15. In the US in 2017, 15 percent of survey respondents stated that they had more than 11 mobile retailer apps on their smartphones. (Source)
Frequent shoppers collect apps from several of their favorite stores, perhaps hoping for discounts and promotions. Reach out with push notifications and emails to encourage sales, then follow up with an integrated in-app experience.
16. 80 percent of shoppers use a mobile phone inside of a physical store to either look up product reviews, compare prices, or find alternative store locations. (Source)
Even if the mobile conversion rate isn’t the best thanks to abandoned shopping carts, smartphones still play a role in the shopping process. Maintaining an engaging, optimized retail app will help users browse and research specific products, even if the final conversion happens on another channel.
17. 86 percent of shoppers would find it beneficial to receive store offers or coupons on their mobile devices, while shopping in their favorite stores. (Source)
Users are happy to receive discounts and coupons. Use geolocation targeting to share special offers with brick-and-mortar shoppers.
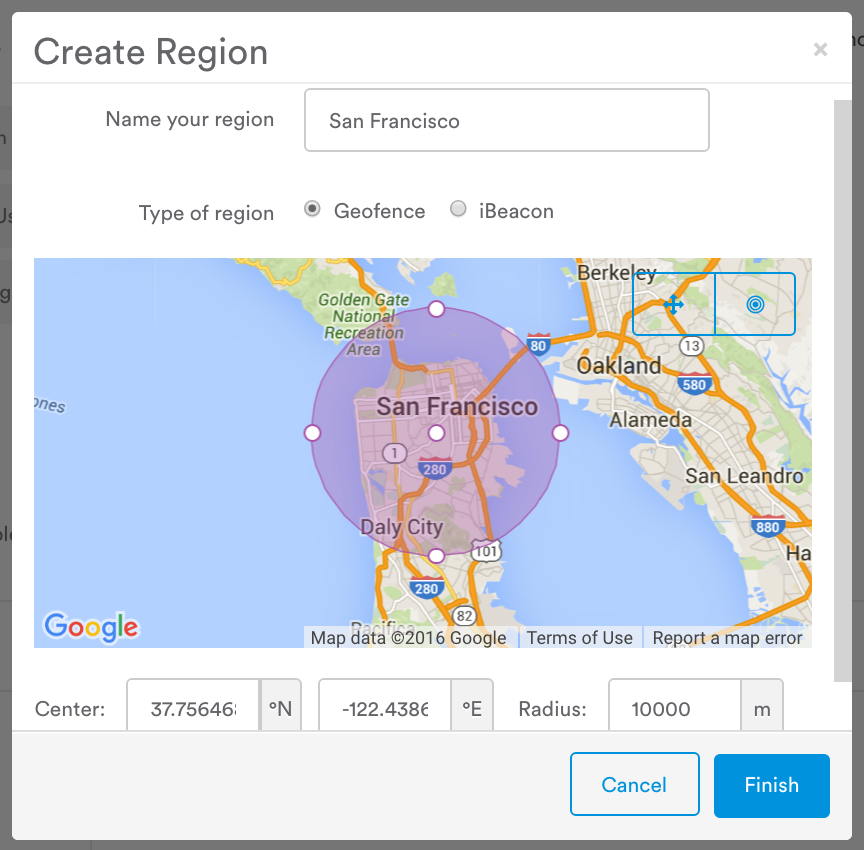
18. 90 percent of US mobile users keep location services turned on. (Source)
Good news for marketers planning a geolocation campaign: There’s little need to worry about collecting location data from the majority of your userbase. Geolocation is as feasible as any other type of messaging campaign.
19. 36 percent of users who start the purchase process on mobile finish it on a different device. (Source)
Sure enough, data suggests that even when mobile isn’t the direct driver of revenue, it still plays a vital role in the purchase flow.
20. 39 percent of customers spend more when they receive a personalized mobile coupon. (Source)
Personalization is integral to everything you do on mobile. Try personalizing coupons to suit a customer’s favorite product category.
21. 50 percent of all smartphone owners check their notifications as soon as they wake up. (Source)
Notification timing is important. If you manage a retail app, you wouldn’t want to send customers a limited-time offer in the middle of the night — they might miss the notification or completely forget about the offer by the time they get up. Send messages at the right time to maximize impact.
—
Leanplum is the mobile marketing platform built for engagement. We help brands like NBC, Tinder, Grab, TED, and Zynga orchestrate multi-channel campaigns — from messaging to the in-app experience — all from a single, integrated platform. Schedule your personalized demo here.